
Chapter 6 Research Platforms
In this chapter, we will provide examples of computing platforms designed to help researchers. You might find these platforms useful for your work. Please note that we aim to provide a general overview of options, and thus, this is not a complete list. Let us know if there is a platform or system that you think we should include!
We highly suggest you also read the next chapter, which will point out important considerations to think about when deciding to work on a shared computing resource platform, like those discussed in this chapter.
The major advantage of these platforms is that users can analyze data where it lives, as many platforms host public data. However, some also allow you to upload your own data. There is less need for data transfers back and forth to your personal computer, as you can analyze your data, store your data and share it in one place, saving time. Users can sometimes also share how they did their analysis as well, improving reproducibility practices. Additionally, another advantage is that some of these platforms also provide educational material on how to work with data.
Many offer a graphical user interface also simply called just graphical interface or GUI (side note: GUI is pronounced like the word “gooey”, as if it’s a sticky jelly stuck to the monitor!), allows for users to choose functions to perform by interacting with visual representations, which can be useful for individuals how are less comfortable writing code. They have a “user-centered” design that creates a visual environment where users can for example click on tabs, boxes, or icons for to perform functions. This also often allows users to more directly see plots and other types of visualizations.
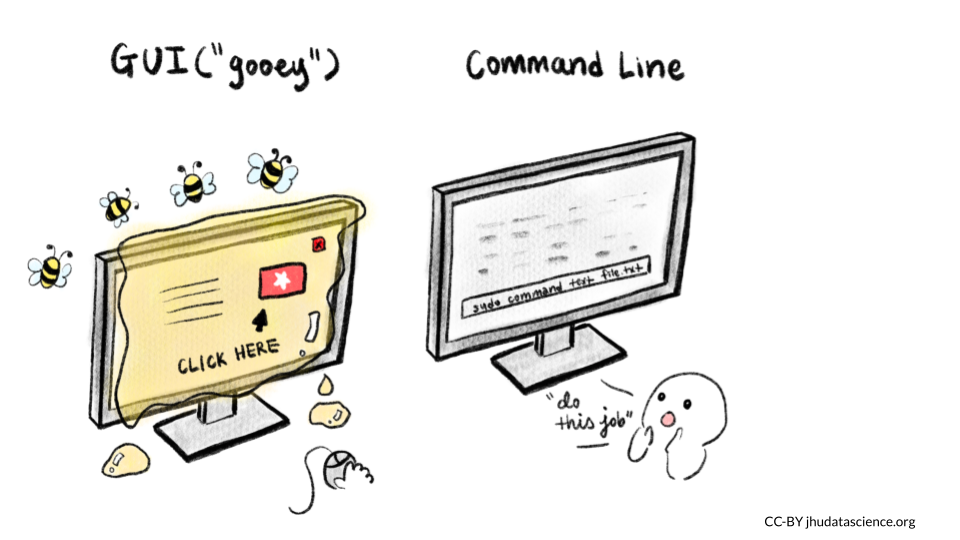
Some platforms also offer a command line interface (also known as a character interface) which allows for software functions to be performed by specifying through commands written in text. This typically offers more control than a GUI; however, command line interfaces are often less user-friendly as they require that the user know the correct commands to use.
6.0.1 National Cancer Institute Cloud Resources
Funded by the National Cancer Institute (NCI), the cancer research data commons provides data access and computing infrastructure for researchers through three different platforms, the Cancer Genomics Cloud (CGC) which uses Google Cloud resources, the Institute for Systems Biology Cancer Gateway in the Cloud (ISB-CGC) which also uses Google Cloud resources, and FireCloud from the Broad Institute, which uses Amazon Cloud resources.
6.0.2 Cancer Genomics Cloud
The Cancer Genomics Cloud (CGC) is a computing platform that researchers can use to analyze, store, and share their own data, as well as work with large public and controlled cancer data sets, including genomic and imaging data. CGC offers tutorials and guides to help research get started, as well as $300 of free credits to use the platform and test it out. Users can also access many tools and workflows to help them perform there analyses. CGC also offers regular webinars.
The platform is based on a partnership with Seven Bridges, a biomedical analytics company, and can be accessed simply by using a web browser. Users can use a point-and-click system (GUI) or access resources using the command line. See this link to learn more.
6.0.3 Institute for Systems Biology (ISB) Cancer Gateway in the Cloud
The ISB-CRC platform allows users to browse and data from the Genomic Data Commons and other sources, including sequencing and imaging data that are both public and controlled. They provide access pipeline tools, as well as to pipelines, workflows, and Notebooks written by others in R and Python to help users perform analyses. ISB also offers $300 in free credits to try out the platform. See here for a user guide.
6.0.4 Broad Institute FireCloud
FireCloud provides users with computing resources and access to workspaces using Broad’s tools and pipelines. Users can run large scale analyses and work with collaborators. FireCloud offers access to The Cancer Genome Atlas (TCGA) controlled-access data. Other platforms described next, like Galaxy and Terra, share resources with FireCloud.
6.0.5 Galaxy
This section was written by Jeremy Goecks:
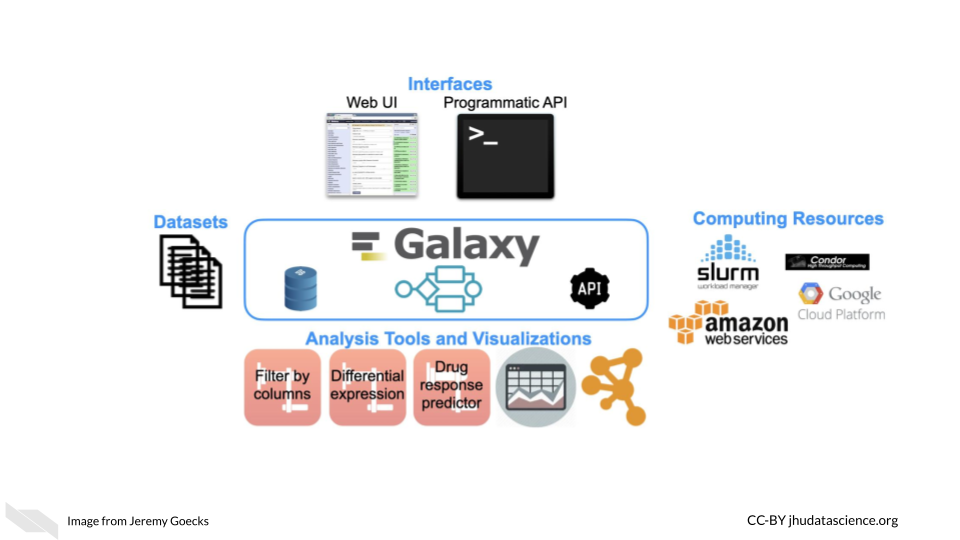
Galaxy is a web-based computational workbench that connects analysis tools, biomedical datasets, computing resources, a graphical user interface, and a programmatic API. Galaxy (https://galaxyproject.org/) enables accessible, reproducible, and collaborative biomedical data science regardless of a user’s informatics expertise. There are more than 8,000 analysis tools and 200 visualizations integrated into Galaxy that can be used to process a wide variety of biomedical datasets. This includes tools for analyzing genomic, transcriptomic (RNA-seq), proteomic, metabolomic, microbiome, and imaging datasets, tool suites for single-cell omics and machine learning, and thousands of more tools. Galaxy’s graphical user interface can be used simply through a web browser, and there is a programmatic API for performing scripted and automated analyses with Galaxy.
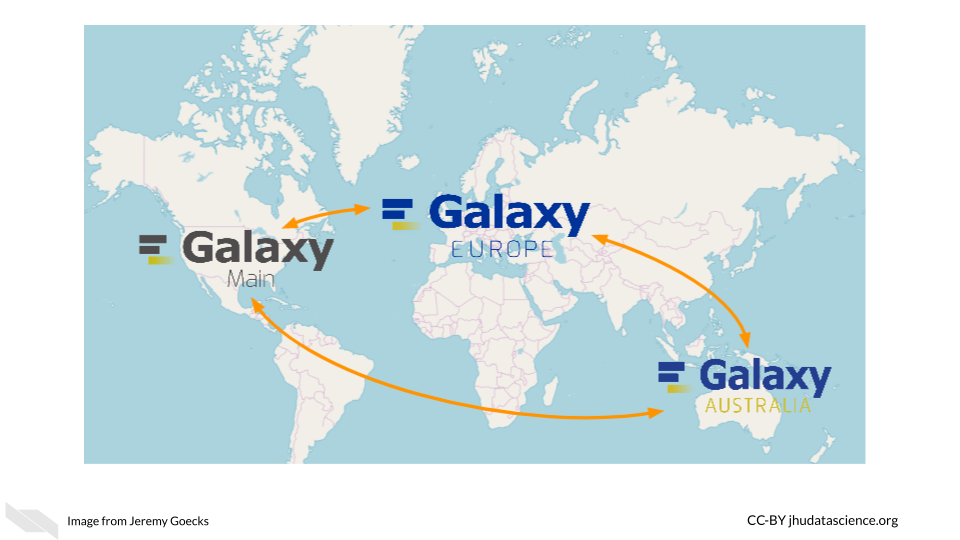
Galaxy is used daily by thousands of scientists across the world. A vibrant Galaxy community has deployed hundreds of Galaxy servers across the world, including more than 150 public and three large national/international servers in the United States, Europe, and Australia (https://usegalaxy.org, https://usegalaxy.eu, https://usegalaxy.org.au). The three national/international servers have more than 250,000 registered users who execute >500,000 analysis jobs each month. Galaxy has been cited more than 10,000 times with >20% from papers related to cancer. The Galaxy Tool Shed (https://usegalaxy.org/toolshed) provides a central location where developers can upload tools and visualizations, and users can search and install tools and visualizations into any Galaxy server. Galaxy has a large presence in the cancer research community. Galaxy serves as an integration and/or analysis platform for 7 projects in the NCI ITCR program. There is also increasing use of Galaxy in key NIH initiatives such as the NCI Cancer Moonshot Human Tumor Atlas Network (HTAN) and the NHGRI Data Commons, called the AnVIL (https://anvilproject.org/).
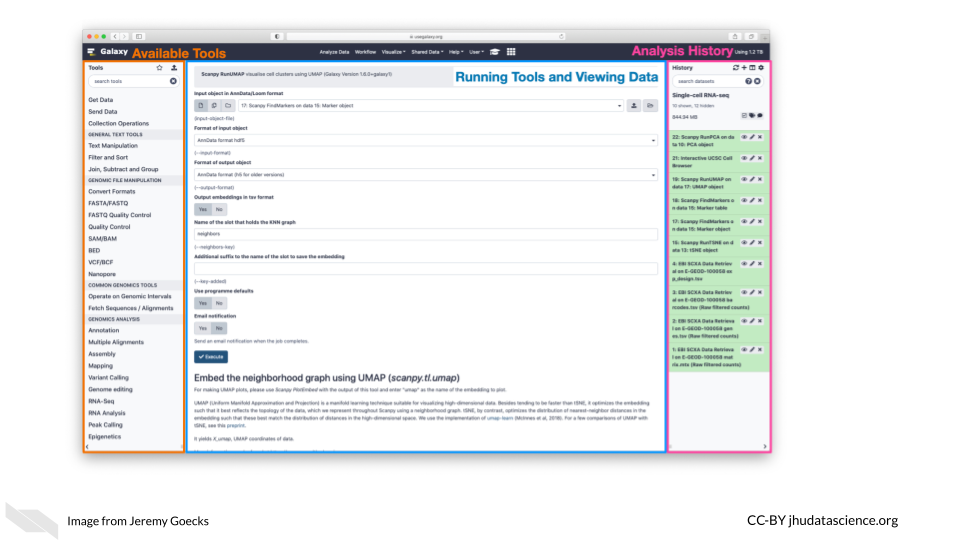
Galaxy’s user interface, accessible via a web browser, provides access to all Galaxy functionality. The main Galaxy interface has three panels: available tools (left), running analyses and viewing data (middle), and a full history of tools run and datasets generated (right).
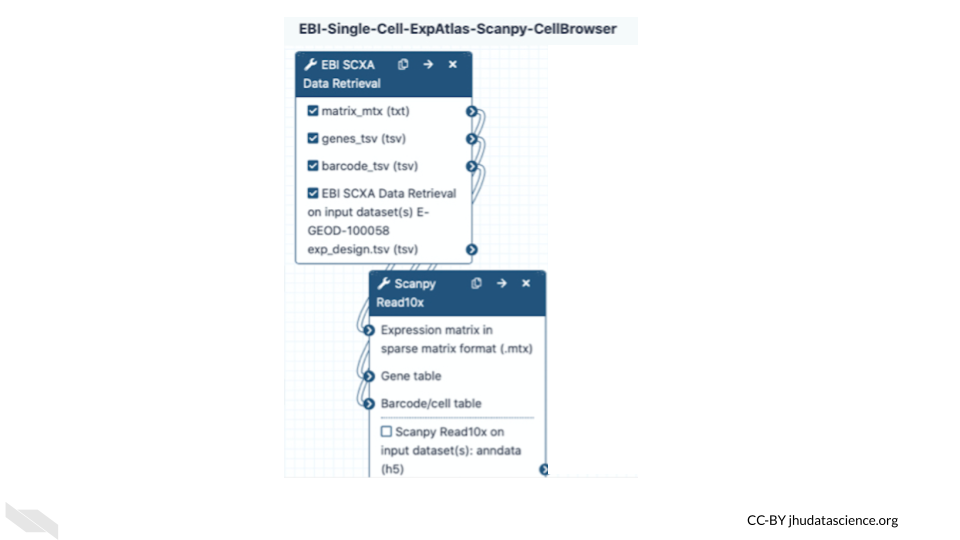
Datasets for analysis in Galaxy can be uploaded from a laptop or desktop computer or obtained from public data repositories connected to Galaxy. With Galaxy, complex workflows composed of tens or even hundreds of analysis tools can be created and run. In Galaxy’s workflow interface, tools can be added and connected via a simple drag-and-drop approach.
Galaxy users can share all their work—analysis histories, workflows, and visualizations—via simple URLs. They can be shared to specific colleagues or to anyone. Furthermore, Galaxy’s user interface is highly scalable. Tens, hundreds, or even thousands of datasets can be grouped into collections and run in parallel using individual tools or multi-tool workflows. In summary, Galaxy is a popular computational workbench with tools and features for a wide variety of data analyses, and it has broad usage in cancer data analysis.
See here for the list of applications supported by Galaxy and here for more information on how to use Galaxy resources.
6.0.6 Terra
Terra is a biomedical research computing platform that is based on the Google Cloud platform. Terra also allows users easier ways to manage the billing of their projects. It provides users with access to data, workflows, interactive analyses using Jupyter Notebooks, RStudio, and Galaxy, data access and tools from FireCloud from the Broad Institute, as well as workspaces to organize projects and collaborate with others. Terra also has many measures to help ensure that data are secure. They also offer clinical features to make sure health data is protected. Note that users who do upload protected health information must select to use extra clinical features and enter a formal agreement with Terra/FireCloud about their data. See here for more information.
Importantly users can get access to use Genotype -Tissue Expression (GTEx), Therapeutically Applicable Research to Generate Effective Treatments (TARGET) and The Cancer Genome Atlas (TCGA) data using the platform. See here for information on how.
Users can pay for data storage and computing costs for Google Cloud through Terra. That said, browsing data is free.
Check out this video for more information:
6.1 AnVIL
If you could use some guidance on how to perform analyses using Galaxy and Terra, especially for genomic research, check out AnVIL, the National Human Genome Research Institute (NHGRI) Analysis Visualization and Informatics Lab-space. It also provides access to many important genomic and related datasets from the NHGRI.
According to their website:
By providing a unified environment for data management and compute, AnVIL eliminates the need for data movement, allows for active threat detection and monitoring, and provides elastic, shared computing resources that can be acquired by researchers as needed.
AnVIL relies on Terra for the cloud based compute environment, Dockstore for standardized tools and workflows, Gen3 for data management for querying and organizing data, Galaxy tools and environment for analyses with less code requirements, and Bioconductor tools for R programming users.
Bioconductor is a project with the mission to catalog, support, and disseminate bioinformatics open-source R packages. Packages have to go through a review process before being included.
6.2 CyVerse
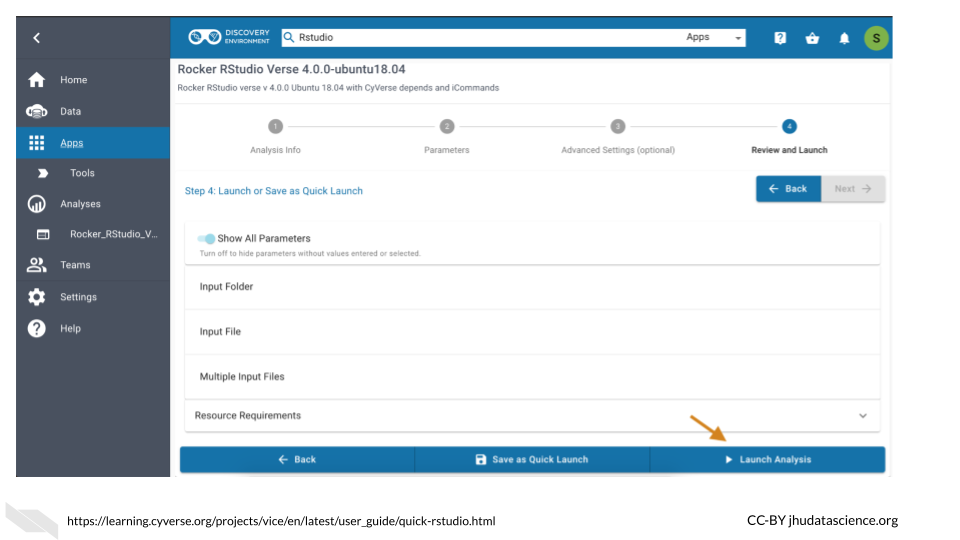
CyVerse is a similar computing platform that also offers computing resources for storing, sharing, and working with data with a graphical interface, as well as an API. Computing was previously offered using the cloud computing platform from CyVerse called Atmosphere, which relied on users using virtual machines. Users will now use a new version of Atmosphere with partnership with Jetstream. This allows users to use containers for easier collaboration and also offers US users more computing power and storage. Originally called iPlant Collaborative, it was started through funding from the National Science Foundation (NSF) to support life sciences research, particularly to support ecology, biodiversity, sustainability, and agriculture research. It is led by the University of Arizona, the Texas Advanced Computing Center, and Cold Spring Harbor Laboratory. It offers access to an environment for performing analyses with Jupyter (for Python mostly) and RStudio (for R mostly) and a variety of tools for Genomic data analysis. See here for a list of applications that are supported by CyVerse. Note that you can also install tools on both platforms. Both CyVerse and Galaxy offer lots of helpful documentation, to help users get started with informatics analyses.
See here to learn more.
6.3 SciServer
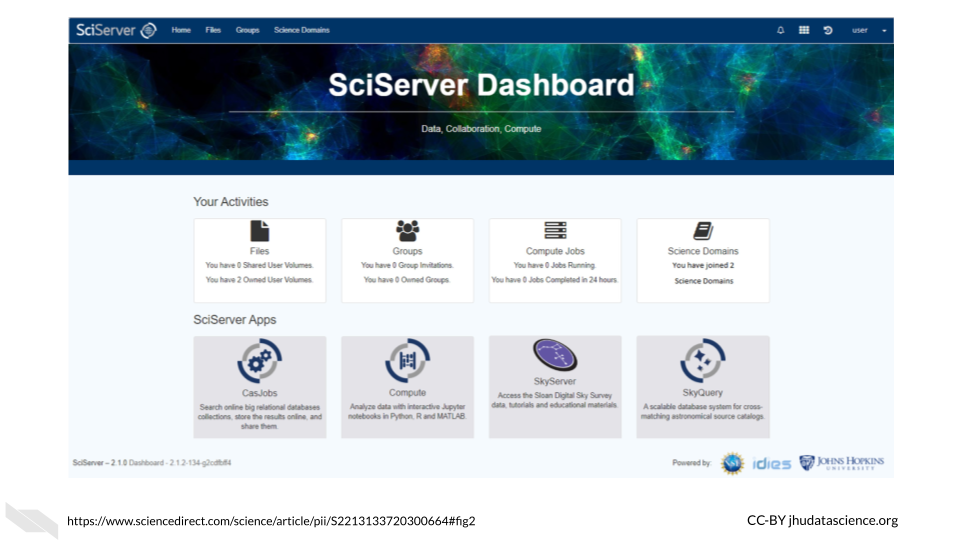
SciServer is accessible through a web browser and allows users to store, upload, download, share, and work with data and common tools on the same platform. It was originally built for the astrophysics community (and called SkyServer) but it has now been adapted to be used by scientists of all fields and is indeed used by many in the genomics field. It allows users to use Python and R in environments like Jupyter notebooks and RStudio, and also supports (Structured Query Language) SQL for data querying and management and is built on the use of Docker.
The main idea of SciServer is based on this premise: “bring the analysis to the data”. It is free to use after users register. However, users can buy extra resources. Users can keep data private or share their data.
As compared to Galaxy, these resources may be better for users with a bit more familiarity with informatics but who require more flexibility. Specifically, these resources are ideal for working with collaborators such as physicists or material scientists, as there are more tools supported across disciplines. In addition, SciServer also gives users access to very large data sets on Petabyte-scale (note that some of these require special permission to use) and supports developers to create their own web interfaces called SciUIs for particular use cases.
For Taghizadeh-Popp et al. (2020) for more information.
6.4 Materials Cloud
Another resource that might be of interest to Python users, particularly those who collaborate with material scientists, is Materials Cloud. It is designed to promote reproducible work, collaboration, and sharing of resources among scientists, particularly for simulations for the materials science field. Users can share data in a citable way, download data, upload data, share workflows, and perform analyses.
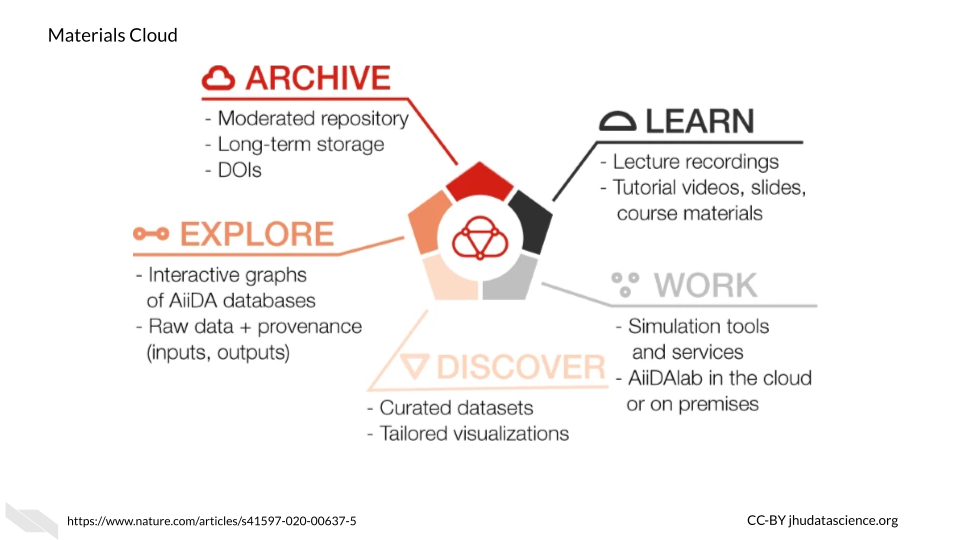
This resource uses AiiDAlab as the computing environment for researchers, which is based on AiiDA. According to their website:
AiiDAlab builds on AiiDA as the computational workflow engine, and the Jupyter environment (notebooks, widgets, …) for writing and sharing apps
See here to learn more about how AiiDAlab supports the sharing of scientific workflows, particularly for those that use Python.
To learn more about Materials Cloud, check out Talirz et al. (2020).
6.5 Overture
Overture is a relatively new option to perform large-scale genomic data analyses. You can upload, download, manage, analyze and share your data with authentication and authorization methods to add security. Although designed for genomic research, the data management system can be used for other scientific domains. Currently, additional products are still being developed for analysis, visualization, and sharing. However, several collaborations have created new incredible resources using some of the existing and developing products that might be useful for your research. Alternatively, Overture has options to help you create your own platform - see here for more information. It is compatible with Google, Microsoft Azure, and PostgreSQL for storage options.
These collaborations using Overture products can be found on the case studies page of the Overture website.
For example, the Cancer Genome Collaboratory is one such collaboration. This is a cloud-based resource that allows researchers to perform analyses using International Cancer Genome Consortium (ICGC) cancer genome data, which includes tumor mutation data from the The Cancer Genome Atlas (TCGA) and the Pan-Cancer Analysis of Whole Genomes (PCAWG) mutation data. See here for information about billing, storage capacity, access, and security.
In addition, Overture products have also been used to create other data resources, such as the Kids First Data Resource Portal which has childhood cancer and birth defect genomic data for over 76,000 samples, and the National Cancer Institute’s Genomic Data Commons Data portal, which also includes The Cancer Genome Atlas (TCGA) and Therapeutically Applicable Research to Generate Effective Treatments (TARGET). The portal supports some basic analyses as well for clinical data statistics and survival analysis.
6.6 Globus
This section was written by Brigitte Raumann:
Globus (www.globus.org) is a cloud-hosted service for secure, reliable research data management that allows data movement, synchronization, sharing, and discovery. Users access Globus services via a web interface or command line interface. Developers can integrate Globus capabilities into their research applications and data portals.
The Globus Transfer service provides ‘fire and forget’ high-performance data transfer and synchronization between storage system such as laptops, supercomputers, tape archives, HPC clusters, scientific instruments, as well as public cloud storage. Globus enables researchers to share their data without the need to create temporary collaborator accounts on local storage systems and without the need to copy data to an external file sharing service. This technology ensures that data movement and sharing of hundreds of terabytes of data, in some cases petabytes of data, can be done in a manner that ensures data confidentiality, minimizes demands on researchers’ time, and makes efficient use of available cyberinfrastructure. Transfer and sharing of protected data, such as HIPAA-regulated data, is also supported. Globus can also automate tasks as simple as replicating data across multiple storage systems or as intricate as managing multiple conditional data analysis and results distribution tasks, with optional human intervention where needed for review and confirmation.
User stories and usage briefs provide multiple examples of how users have widely applied Globus to research data management challenges.
The University of Chicago develops and operates Globus and provides free file transfer for users engaged in non-profit research. Institutions can subscribe to Globus to access additional features. Pricing is based on the research expenditures of the institution.
6.7 BaseSpace Sequence Hub
BaseSpace is a platform that allows for data analysis of Illumina sequencing data and syncs easily with any Illumina sequencing machines that you might work with. There are many applications available to help you with your genomics research. They offer a 30-day free trial.
6.8 ATLAS.ti
ATLAS.ti is designed particularly for qualitative analysis. You can use a variety of data types including video, audio, images, surveys, and social media data. A variety of tools, particularly for text data analysis, are provided for methods such as sentiment analysis, which is the process of assigning a general tone or feeling to text and named-entity recognition, which is the process of extracting certain characteristics from texts that are what is called a [named entity] or a real-world object - such as a person’s name or address. Such analyses can be helpful for understanding behaviors that might be associated with cancer risk. Although this type of analysis can be performed using R or Python among other coding languages, ATLAS.ti offers a nice graphical user interface to perform these types of analyses. Furthermore, ATLAS.ti offers a great deal of flexibility about such analyses, enabling users to easily incorporate different data types.
6.9 GenePattern
GenePattern is similar to Galaxy in that it provides a web-based interface for genomic analyses. You can upload your own data, use workflows and pipelines form others and more!
See here to access their user guide and here for a quick start guide to using GenePattern Notebook which uses Jupyter Notebooks and GenePattern analysis tools to easily create data analysis reports. Users can also publish and share their notebooks with collaborators or the field, as well as access other people’s notebooks that they can adapt for their own uses. See here for a collection of available notebooks.
6.10 XNAT
XNAT offers computing resources and tools for performing imaging analysis and for storing and sharing imaging data in a HIPAA complaint manner (more on that in the coming). Developed by the Bukner lab previously at the Washington University and now at Harvard, it supports a variety of imaging data as well as other data types like clinical data. Some tools can be used with a graphical interface and others with the command-line. See here for example use cases. There is also a great deal of documentation available about how to use the tools and resources available at https://wiki.xnat.org/documentation.
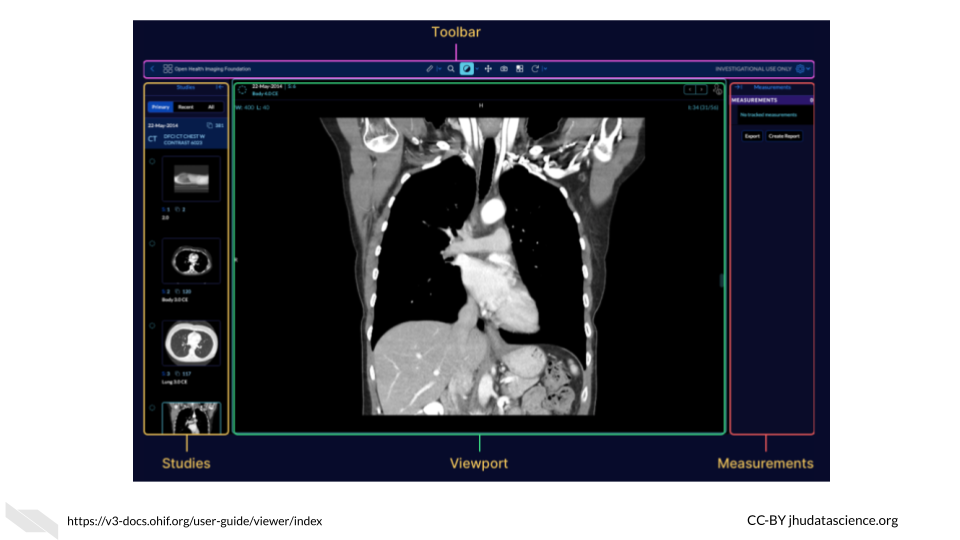
6.11 OHIF
The open health imaging foundation (OHIF) is a web-based imaging analysis platform that is widely used, particularly for radiology analysis, but it also supports whole-slide microscopy image analysis. It was developed by Gordon Harris et al. and can be used for a variety of applications from cardiology to veterinary medicine. Check out these example use cases of OHIF. OHIF also provides thorough documentation with images and videos about how to use the image viewer and tools available.
For those interested, Gordon Harris and others are also working on a project called Cornerstone, with the goal of providing software for others to display medical images in web browsers.
6.12 PRISM
The Platform for Imaging in Precision Medicine, called PRISM, works behind the scenes in the Cancer Imaging Archive (TCIA) to allow users to work with the vast data available in TCIA, in terms of both imaging data and clinical information.
According to Fred Prior:
It is designed to collect, curate and manage Radiology and Pathology images, clinical information associated with those images, annotations and image derived feature sets. PRISM is designed to run on a Kubernettes cluster, but all of the components are containerized so they can run stand-alone or in an alternate orchestration framework.
See this article for more information.
6.13 Conclusion
We hope that this chapter has given you some more perspective on the various computing options available designed for researchers like you. We also hope that you may have learned about some potential platforms that can help you to make your research faster and more flexible.
In conclusion, here are some of the major take-home messages:
Computing platforms are cyberinfrastructures that allow you to perform analyses with existing data and or allow you to upload, work with, and share your own data.
There are quite a few platforms that are well developed with in depth documentation to support research quite broadly and allow users to work with a diverse set of data.
There are also platforms that were designed for specific research needs.