
8.3 Exercise One: Examining fastq Files in Galaxy
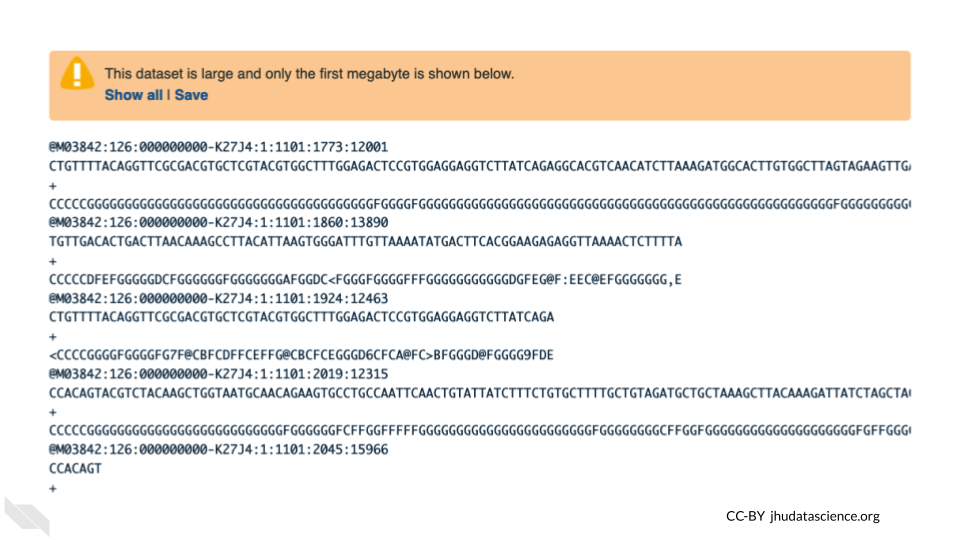
Now we have some data in our account we can look at it. In this exercise we will see data in fastq format. This is the typical output from an Illumina Sequencer, but also the standard format for most alignment software.
8.3.1 Examining Inputs
Use your mouse and click on the eye icon (![]() ) of the first
) of the first fastq file (VA_sample_forward_reads.fastq). In the Main screen you will see something like this:
QUESTIONS:
How many lines in a .fastq file represent an individual read?
What does each line represent?
Why is the final line for each read (the quality score) important?
8.3.2 Quality Scoring
FastQC is a tool which aims to provide simple quality control checks on raw sequence data coming from high throughput sequencing pipelines. It provides a set of analyses which you can use to get a quick impression of whether your data has any problems of which you should be aware before doing any further analysis.
Find the FastQC tool in the GENOMIC FILE MANIPULATION: FASTQ Quality Control tool folder. You will see something like this in the tools:
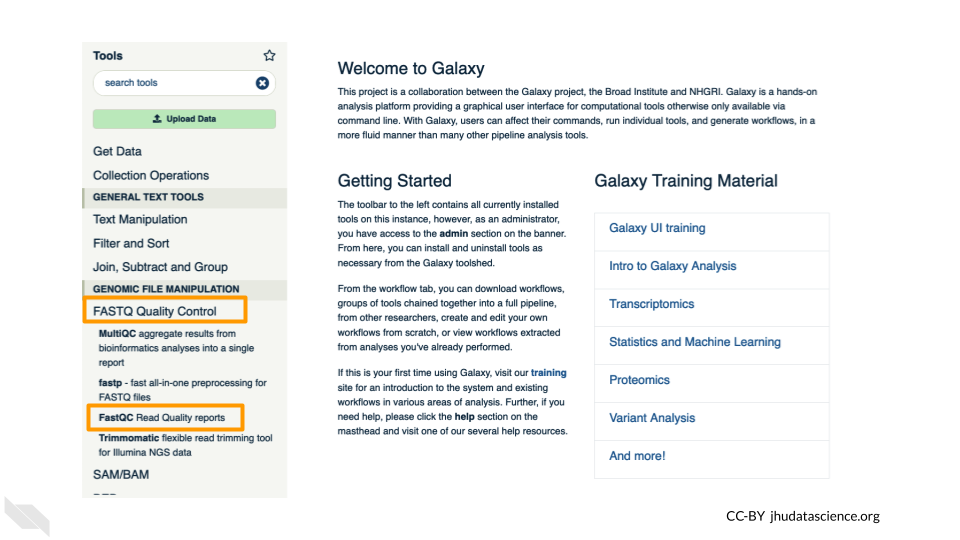
In the first drop down menu, make sure it has your first fastq file (VA_sample_forward_reads.fastq) loaded. Leave everything else as-is and click on the blue execute button at the bottom of the screen.
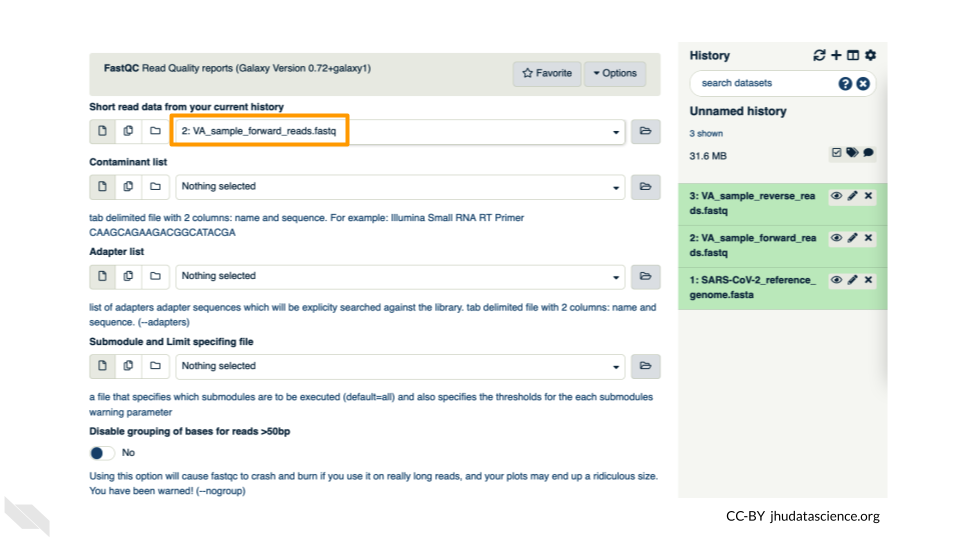
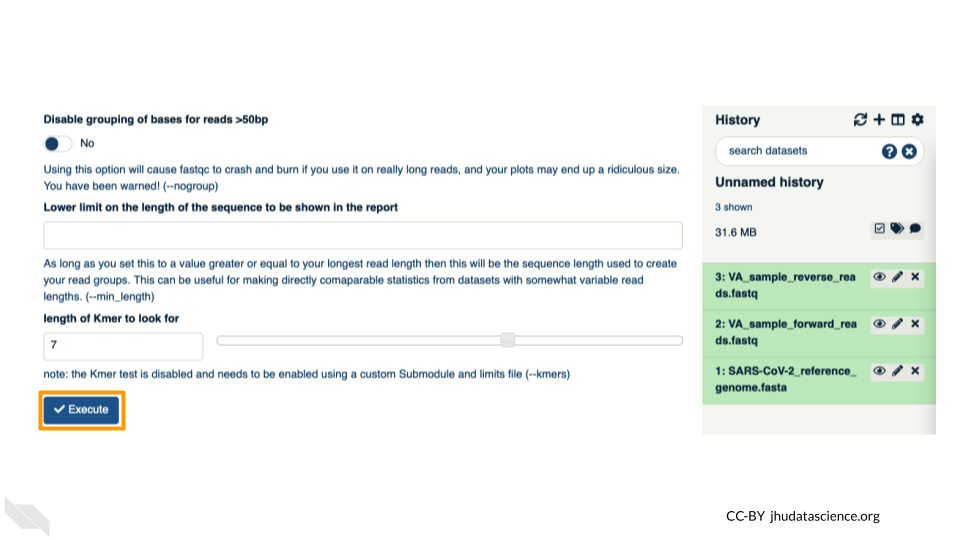
The main dash will highlight in green if everything is okay. In the history, you will see the new files turn yellow, then green. If the job fails it will show an error.
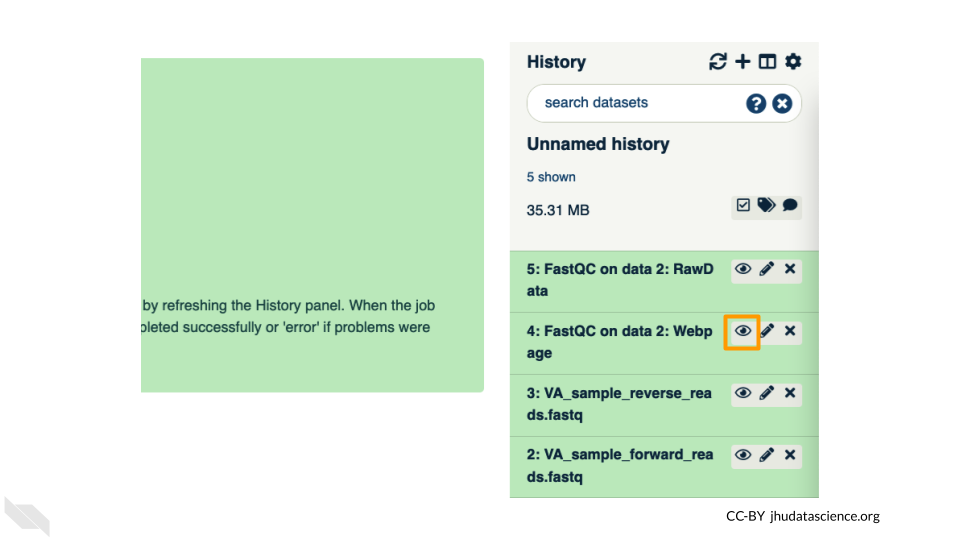
Click on the eye icon (![]() ) in the new file in the history “FASTQC on data2 Webpage”.
) in the new file in the history “FASTQC on data2 Webpage”.
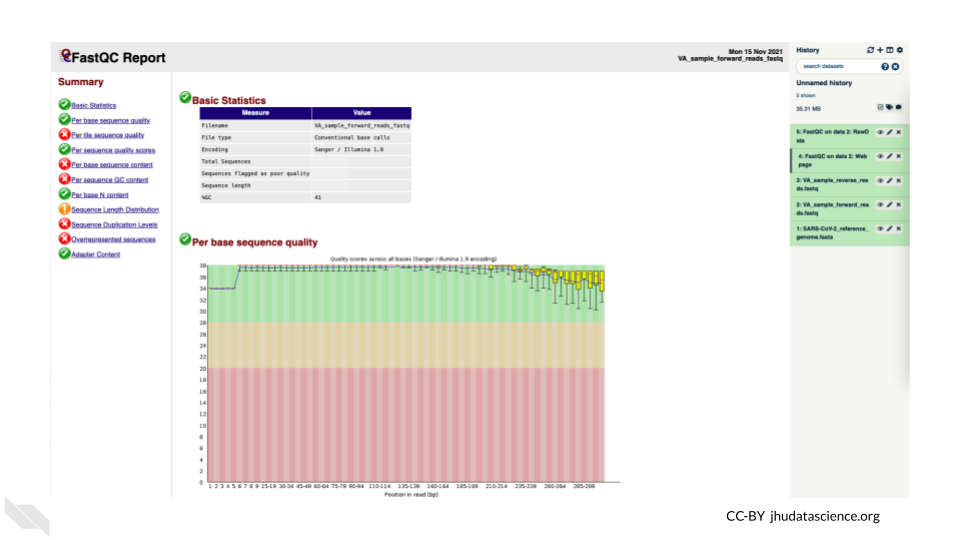
You will open up a summary report for the sequencing file:
QUESTIONS:
Explore “Basic Statistics”. How many total reads are there? Have any been flagged as poor quality? What is the sequence length?
Explore “Per base sequence quality”. Based on the Basic Statistics, is 28-40 a good or bad quality score?
Is it okay to proceed based on the per base sequence quality?
Breakout Box: Learn more about quality scores
You may be wondering how the fourth line of the .fastq files relates to the quality score above. To save space, the sequencer records an ASCII character to represent scores 0-42. For example 10 corresponds to “+” and 40 corresponds to “I”. FastQC knows how to translate this. This is often called “Phred” scoring.
What does 0-42 represent? These numbers, when plugged into a formula, tell us the probability of an error for that base. This is the formula, where Q is our quality score (0-42) and P is the probability of an error:
Q = -10 log10(P)
Using this formula, we can calculate that a quality score of 40 means only 0.00010 probability of an error!